مجموعة تكنولاب البهاء جروب
تحاليل وتنقية ومعالجة المياه
|
تنظيف وتطهير وغسيل واعادة تاهيل الخزانات

معمل تكنولاب البهاء جروب
للتحاليل الكيميائية والطبية
والتشخيص بالنظائر المشعة
للمخدرات والهرمونات والسموم
وتحاليل المياه

مجموعة
تكنولاب البهاء جروب
لتصميم محطات الصرف الصناعى والصحى
لمعالجة مياه الصرف الصناعى والصحى
مجموعة تكنولاب البهاء جروب
المكتب الاستشارى العلمى
دراسات علمية كيميائية
معالجة الغلايات وانظمة البخار المكثف
معالجة ابراج التبريد المفتوحة
معالجة الشيللرات
مجموعة تكنولاب البهاء جروب
اسنشاريين
كيميائيين/طبيين/بكترولوجيين
عقيد دكتور
بهاء بدر الدين محمود
رئيس مجلس الادارة
استشاريون متخصصون فى مجال تحاليل وتنقية ومعالجة المياه
متخصصون فى تصنيع وتصميم كيماويات
معالجة الصرف الصناعى والصحى
حسب كل مشكلة كل على حدة تصنيع وتحضير كيماويات معالجة المياه الصناعية
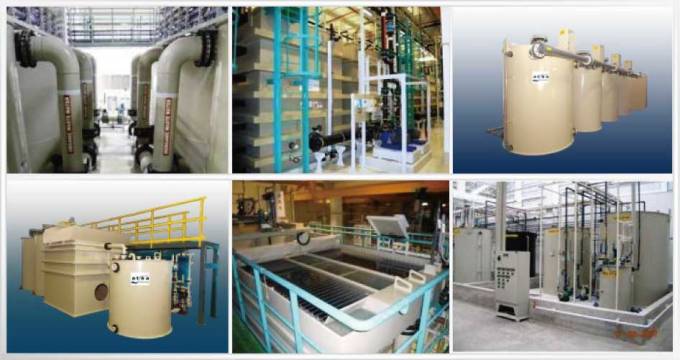
مؤتمرات/اجتماعات/محاضرات/فريق عمل متميز     صور من وحدات معالجة المياه
 technolab el-bahaa group technolab el-bahaa groupTECHNOLAB EL-BAHAA GROUP
EGYPT
FOR
WATER
TREATMENT/PURIFICATION/ANALYSIS
CONSULTANTS
CHEMIST/PHYSICS/MICROBIOLIGIST
INDUSTRIAL WATER
WASTE WATER
DRINKING WATER
TANKS CLEANING
CHAIRMAN
COLONEL.DR
BAHAA BADR EL-DIN
0117156569
0129834104
0163793775
0174041455 تصميم وانشاء محطات صرف صناعى/waste water treatment plant design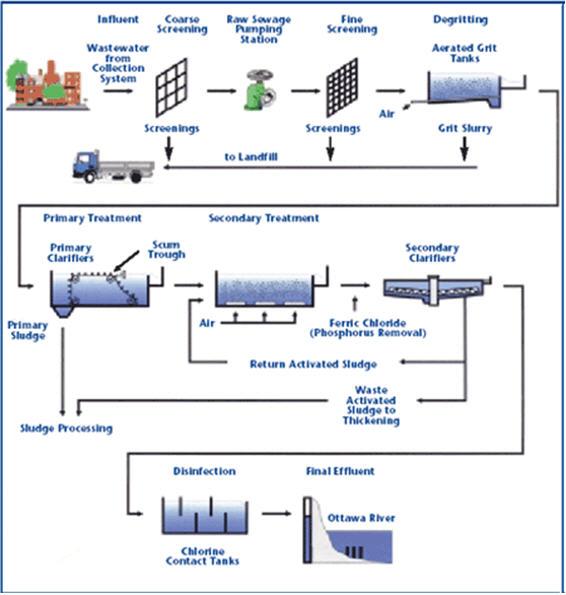 technolab el-bahaa group egypt We are a consultants in water treatment with our chemicals as:- Boiler water treatment chemicals Condensated steam treatment chemicals Oxygen scavenger treatment chemicals Ph-adjustment treatment chemicals Antiscale treatment chemicals Anticorrosion treatment chemicals Open cooling tower treatment chemicals Chillers treatment chemicals Waste water treatment chemicals Drinking water purification chemicals Swimming pool treatment chemicals Fuel oil improver(mazote/solar/benzene) technolab el-bahaa group
egypt
We are consultants in extraction ,analysis and trading the raw materials of mines as:-
Rock phosphate
32%-30%-28%-25%
Kaolin
Quartez-silica
Talcum
Feldspae(potash-sodumic)
Silica sand
Silica fume
Iron oxid ore
Manganese oxid
Cement(42.5%-32.5%)
Ferro manganese
Ferro manganese high carbon technolab el-bahaa group
web sites
e-mails
water treatment unit design 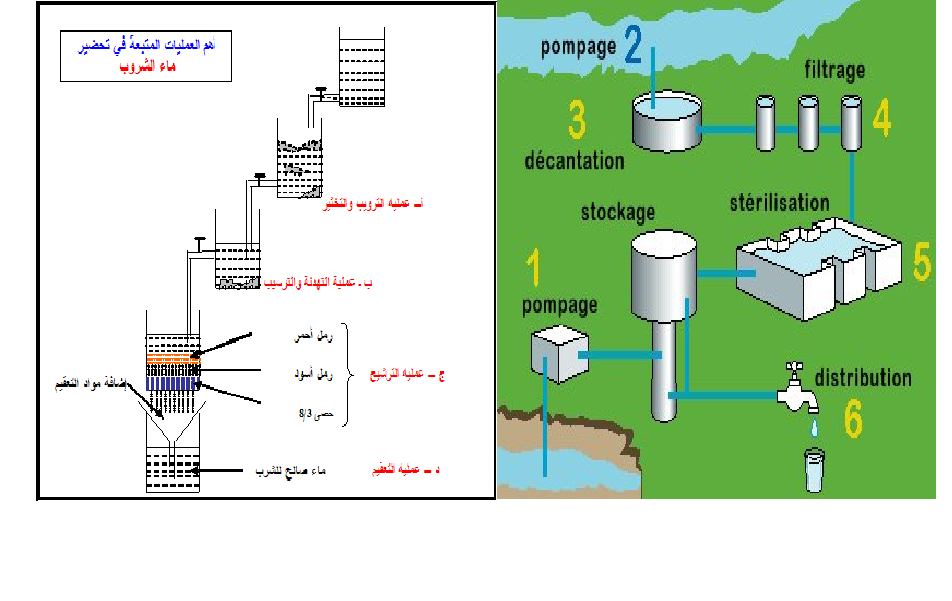
وكلاء لشركات تركية وصينية لتوريد وتركيب وصيانة الغلايات وملحقاتها
solo agent for turkish and chinese companies for boiler production/manufacture/maintance
وكلاء لشركات تركية وصينية واوروبية لتصنيع وتركيب وصيانة ابراج التبريد المفتوحة 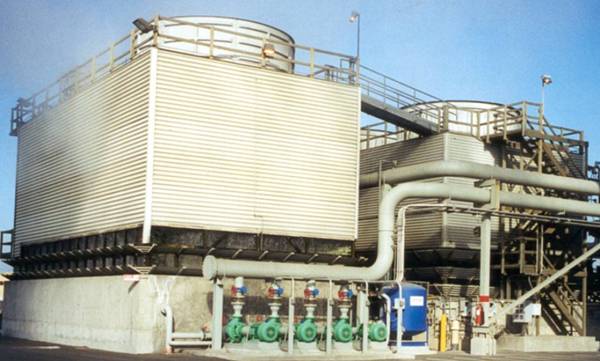
تصميم وتوريد وتركيب الشيللرات
design/production/maintance
chillers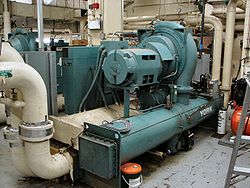 ابراج التبريد المفتوحة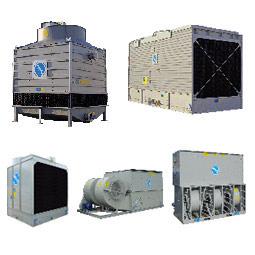 مجموعة تكنولاب البهاء جروب
المكتب الاستشارى العلمى
قطاع توريد خطوط انتاج المصانع
نحن طريقك لاختيار افضل خطوط الانتاج لمصنعكم
سابقة خبرتنا فى اختيار خطوط الانتاج لعملاؤنا
1)خطوط انتاج العصائر الطبيعية والمحفوظة والمربات
2)خطوط انتاج الزيوت الطبيعية والمحفوظة
3)خطوط انتاج اللبن الطبيعى والمحفوظ والمبستر والمجفف والبودرة
4)خطوط تعليب وتغليف الفاكهة والخضروات
5)خطوط انتاج المواسير البلاستيك والبى فى سى والبولى ايثيلين
6)خطوط انتاج التراى كالسيوم فوسفات والحبر الاسود
7)خطوط انتاج الاسفلت بانواعه
 محطات معالجة الصرف الصناعى والصحى بالطرق البيولوجية والكيميائية محطات معالجة الصرف الصناعى والصحى بالطرق البيولوجية والكيميائية9)محطات معالجة وتنقية مياه الشرب
10)محطات ازالة ملوحة البحار لاستخدامها فى الشرب والرى
11)الغلايات وخطوط انتاج البخار الساخن المكثف
12)الشيللرات وابراج التبريد المفتوحة وخطوط انتاج البخار البارد المكثف
للاستعلام
مجموعة تكنولاب البهاء جروب
0117156569
0129834104
0163793775
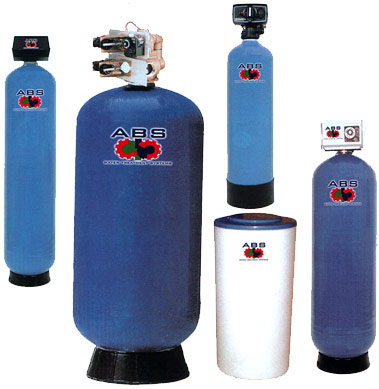
القاهرة-شارع صلاح سالم-عمارات العبور-عمارة 17 ب فلا تر رملية/كربونية/زلطيه/حديدية
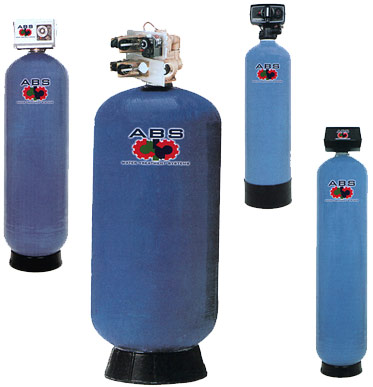
وحدات سوفتنر لازالة عسر المياه
مواصفات مياه الشرب
Drinking water
acceptable
values
50 | colour | acceptable | Taste | nil | Odour | 6.5-9.2 | ph |
1 mg/dl | pb | 5 mg/dl | as | 50 mg/dl | cn | 10 mg/dl | cd | 0-100mg/dl | hg | 8 mg/dl | f | 45 mg/dl | N02 | 1 mg/dl | Fe | 5 mg/dl | Mn | 5.1 mg/dl | Cu | 200 mg/dl | Ca | 150 mg/dl | Mg | 600 mg/dl | Cl | 400 mg/dl | S04 | 200 mg/dl | Phenol | 15 mg/dl | zn |
الحدود المسموح به
ا لملوثات الصرف الصناعى
بعد المعالجة
Acceptable
values
treated wate water
|
7-9.5 | ph | 25-37 c | Temp | 40 mg/dl | Suspended solid | 35 mg/dl | bod | 3 mg/dl | Oil & grase | 0.1 mg/dl | hg | 0.02 mg/dl | cd | 0.1 mg/dl | cn | 0.5mg/dl | phenol | 1.5 ds/m | conductivity | 200 mg/dl | na | 120 mg/dl | ca | 56 mg/dl | mg | 30 mg/dl | k | 200 mg/dl | cl | 150 mg/dl | S02 | 0.75 mg/dl | Fe | 0.2 mg/dl | Zn | 0.5 mg/dl | Cu | 0.03 mg/dl | Ni | 0.09 mg/dl | Cr | 0.53 mg/dl | لb | 0.15 mg/dl | pb |
محطات تحلية مياه البحر بطريقة التقطير الومضى على مراحل MSF+3.jpg (image)محطات التقطير الومضى لتحلية مياه البحر2![[MSF+3.jpg]](https://2img.net/h/4.bp.blogspot.com/_SynCnHGx75g/Shl2T3oVhsI/AAAAAAAAAEY/_7oem5pvQ3I/s1600/MSF%2B3.jpg) some of types of tanks we services
انواع الخزانات التى يتم تنظيفها
ASME Specification Tanks
Fuel Tanks
Storage Tanks
Custom Tanks
Plastic Tanks
Tank Cleaning Equipment
Double Wall Tanks
Septic Tanks
Water Storage Tanks
Fiberglass Reinforced Plastic Tanks
Stainless Steel Tanks
Custom / Septic
مراحل المعالجة الاولية والثانوية والمتقدمة للصرف الصناعى

صور مختلفة
من وحدات وخزانات معالجة الصرف الصناعى
التى تم تصميمها وتركيبها من قبل المجموعة
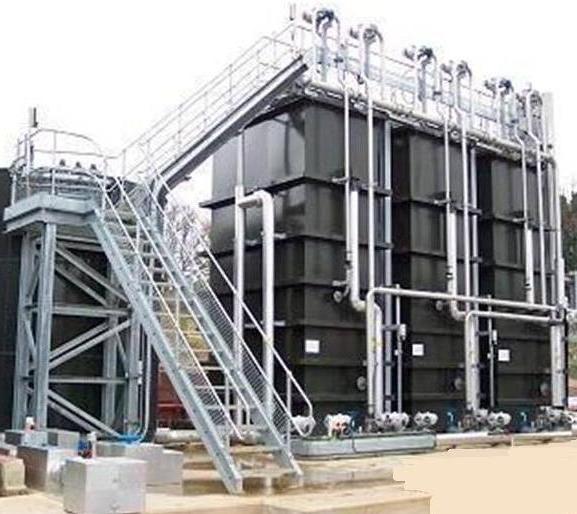
صور
من خزانات الترسيب الكيميائى والفيزيائى
لوحدات معالجة الصرف الصناعى
المصممة من قبل المحموعة
 technolab el-bahaa group
 technolab el-bahaa group technolab el-bahaa group technolab el-bahaa group technolab el-bahaa group technolab el-bahaa group technolab el-bahaa group technolab el-bahaa group technolab el-bahaa group technolab el-bahaa group technolab el-bahaa group technolab el-bahaa group technolab el-bahaa group technolab el-bahaa group technolab el-bahaa group technolab el-bahaa group technolab el-bahaa group technolab el-bahaa group technolab el-bahaa groupمياه رادياتير اخضر اللون
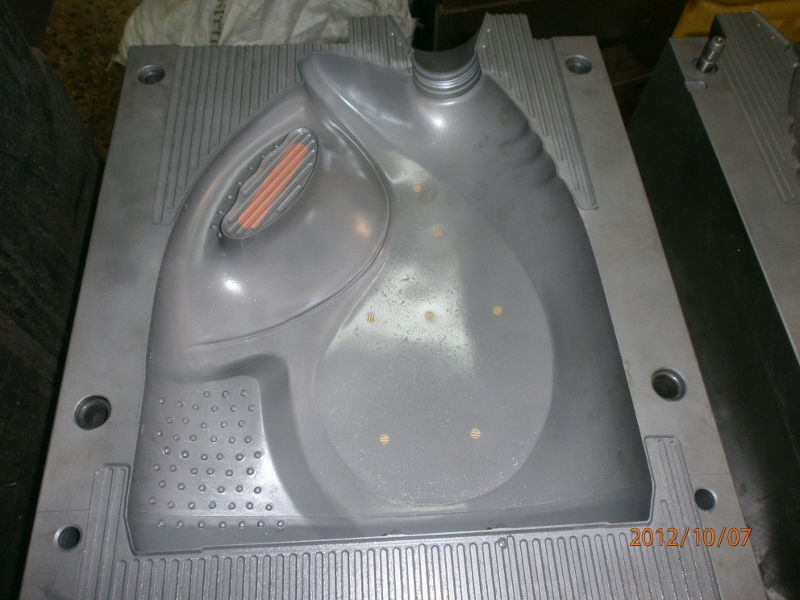
بريستول تو ايه
انتاج شركة بريستول تو ايه - دمياط الجديدة
مجموعة تكنولاب البهاء جروب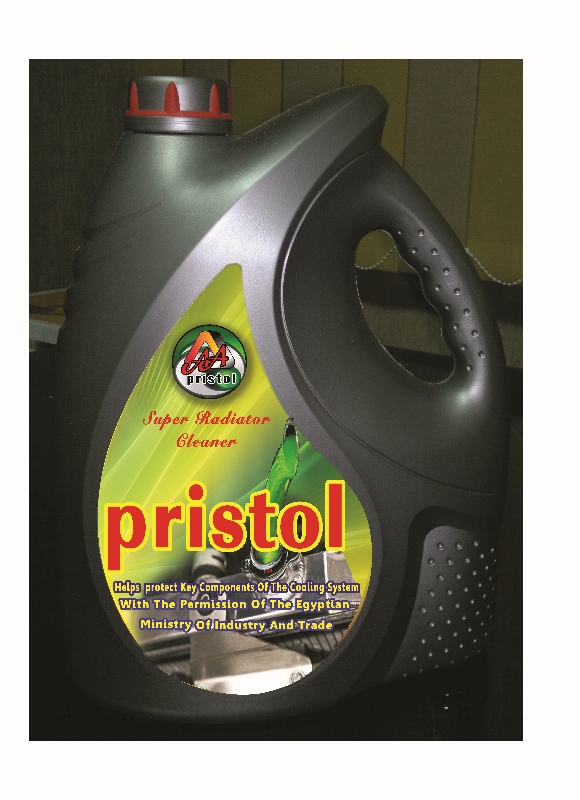
اسطمبات عبوات منتجات شركة بريستول تو ايه-دمياط الجديدة مياه رادياتير خضراء فوسفورية من انتاج شركة بريستول تو ايه بترخيص من مجموعة تكنولاب البهاء جروب 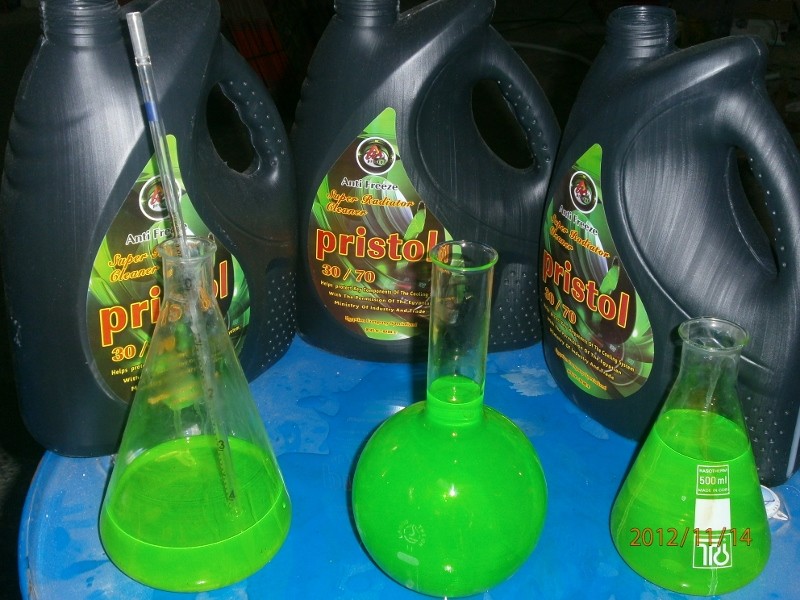

زيت فرامل وباكم DOT3 
|
| | | دراسة جدوى وتصميم وتوريد وتركيب محطات معالجة الصرف الصناعى لخطوط الانتاج بمصنع ابوزعبل للكيماويات والاسمدة |  |
| | | كاتب الموضوع | رسالة |
|---|
Admin
Admin

عدد المساهمات : 3762
تاريخ التسجيل : 15/09/2009
العمر : 56
الموقع : مصر
| موضوع: دراسة جدوى وتصميم وتوريد وتركيب محطات معالجة الصرف الصناعى لخطوط الانتاج بمصنع ابوزعبل للكيماويات والاسمدة  الأحد أغسطس 14, 2011 3:14 am الأحد أغسطس 14, 2011 3:14 am | |
| 1- Background:
TECHNOLAB EL-BAHAA GROUP
COLONEL.DR
BAHAA BADR
CHEMICAL CONSULTANT
Abu Zaabal Company for Fertilizers and Chemicals (AZFC) is one of the largest companies in Egypt for the production of phosphate fertilizers.
It started production in 1947. Before 2004, the company belonged to the public sector and was affiliated to the Holding Company of Chemical Industries.
In 2004 the company was privatized and sold to Polyserve Fertilizers & Chemicals Group.
The company is located 30 km away from Cairo at Moahda road - Abo Zaabal City – Qalyoubia Governorate. The total plant area is 204 Feddan (857,000 m2).
The total number of employees in the company is 1500 working 3 shifts/day, 7 days/week, 330 days/year.
The main raw materials used in the factory are phosphate ore (24-30 %P2O5) with a current consumption rate 628,000 tons/yr and sulfur with yearly consumption rate about 100,000 tons.
The company consists of several production plants and service units:
a- Production Units
• Single Super Phosphate (SSP) plant which includes 4 production lines.
Lines 1, 2, 3 and the recently installed line 4.
Currently, lines 1and 2 are outdated and stopped while line 3 is still operating along with the newly installed line 4.The current production rate is about 1,155,000 tons/yr SSP.
• Phosphoric acid plant which consists of one production line. The production rate is about 136,620 tons/yr. Currently, it is not operating and under upgrading.
• Sulfuric acid plant which includes 3 production units. Units 5, 6 and the recently installed unit 7.
Nowadays, units 5, 6 are not operating and under upgrading while unit 7 is still operating.
The current production rate is about 775,500 tons/yr
• Granulated NPK plant consisting of one production line. The current production rate is about 231,000 tons/yr
• Granulated single super phosphate (GSSP) plant which consists of one production line. The current production rate is about 528,000 tons/yr.
• Granulated Triple Super Phosphate (GTSP) plant which consists of one production line.
The production rate is about 204,600 tons/yr and currently it is not operating and under upgrading.
b- Service units:
- Three water treatment plants to treat water used in production.
- Cooling towers divided as follows :
• Two in sulfuric acid plant, one of them serves units 5 & 6 and the other serves unit 7.
• Two in SSP plant, one for line 1,2 & 3 and the other is for line 4.
- Steam boilers.)
The Company has a domestic wastewater treatment plant with a capacity of 500 m3/d. currently, this plant is under capacity and is not adequate to treat the domestic sewage generated from nearly 1500 workers.
Due to the reduced performance of the sewage treatment plant, the company has stopped the plant until upgrading to provide the required efficiency. A detailed study for upgrading the domestic sewage treatment system is covered in a separate report.
The industrial effluent streams are generated from the different production and service units and are segregated in an internal sewerage network different than that of the domestic sewage.
The levels of contaminants in the industrial waste effluents exceed the allowable limits for discharging to the closest receiving water body (Ismailia Canal) and currently discharged to unlined open ponds on site which can adversely affect the underground water.
The main objectives of this study are:
1- To identify the distribution of water consumptions (hourly & daily basis) in the different production and service units.
2- To characterize the different industrial effluent streams from both production and service units in terms of estimated flows and concentration of contaminants.
3- To describe the discharging scheme of the industrial effluents currently applied in the company.
4- To describe any abatement projects currently implemented or considered for implementation by the company.
5- To recommend the possible control measures for reduction both of hydraulic and pollution loads of industrial effluents in order to comply with environmental regulations.
2. Process Description
2-1- Single Super phosphate plant (SSP)
A process flow diagram for SSP production is shown in figure 3. The stages of SSP production can be summarized as follows:
Phosphate rock is first ground in mills then weighed the powder which then fed by a feed screw conveyer into the mixer (SSP reactor).
Strong H2SO4 (98% H2SO4) and H2O are pumped to a mixing nozzle and cooled to a maximum of 40°C in a graphite heat exchanger before delivery to the mixer.
In the mixer, acid and ground rock are brought into intimate contact; the mixture is remained for sometime in order to complete the exothermic reaction.
The reaction releases steam, CO2 and SiF4.
At the mixer exit, the reaction slurry is solidified and is discharged into the den, where the slurry solidifies into a cake.
At the end of the den, a rotary cutter shaves off the powder SSP which falls on the wide slow cutter belt.
The reaction gases are drawn from the den by the exhaust fan.
The gas is scrubbed to remove solids and fluorine compounds before discharging to atmosphere.
For manufacturing of Granulated SSP, the SSP powder is passed through a granulator, Figure (3) indicates block diagram of SSP production.
2-2-Triple Super phosphate plant (TSP)
The manufacturing steps for TSP are similar to SSP with a major exception being that phosphoric acid is used instead of sulfuric acid.
Ground Rock Phosphate and weak phosphoric acid are fed in regulated amount into a reactor.
The acid attacks the rock and produces a mix of mono and Di Calcium Phosphate which are water soluble and effective fertilizers.
The reaction is:
Ca5F(PO4)3+ 7H3PO4 + 5H2O 5Ca(H2PO4)2•H2O +HF
The phosphoric acid used in this process has a relatively low concentration (26 percent P2O5).
The resultant slurry is pumped and sprayed into a combined granulator/dryer to produce granular TSP.
The product from the dryer is conveyed to a grinding/screening section where product with the desired granule size is separated and removed for packing.
The exhaust gases from the drier are fed through a set of scrubbers where the fluoride vapours from the reactor as fluosilicic acid are catched. Emissions from TSP manufacturing are similar to those of SSP manufacturing.
2-3-NPK production plant
Ammonium Nitrate (N), Triple Super Phosphate (P) and Potassium Chloride (K) are stored in silos then transport to a primary mixer mill by belt conveyors with specific proportions.
The mixed material is subsequently fed along with the recycled fines to a granulator.
These granulates are transferred to the rotary drier to remove moisture in final product to < 8%.
The dried granules are cooled in a cooler and the then ground / classified to obtain the final product. The fines are recycled to the granulator.
The unit also has a drum to further add specialty additives / colour to the finished product.
2-4-Sulfuric acid plant
The main operations are described below
Sulfur is transported from the godown by a set of independent conveyors to the sulfuric acid plants in AZFC (Units 5, 6 and the new unit 7).
Sulfur is melted by steam coils at 140°C then the molten sulfur is filtered to remove any impurities (usually iron or organic compounds) as sludge.
Molten sulfur is pumped to the burner where it is burnt in an excess of dry air
to produce sulphur di-oxide(So2).
The gas stream from the burner at 1050oC and is cooled to 350oC prior conversion to sulphur tri- oxide (So3) using high pressure waste heat boiler which is used to cool the gases and produce superheated steam.
The cooled sulphur di-oxide gas is converted to sulfur trioxide by reacting with oxygen over the catalyst.
The gas temperature must be maintained between 400 - 500°C to maintain high reaction rate and also high conversion equilibrium.
SO3 gas is absorbed in a packed absorption tower to produce sulfuric acid 98% concentration.
The overall reaction can be described by the following equation, where sulfur trioxide reacts with the free water to produce sulfuric acid:
SO3 + H2O → H2SO4 ΔH = -200 kJ mol-1
2-5- The phosphoric acid plant
Phosphate rock is first ground into particles until a specific size then allowed to react with sulfuric acid according to the following reaction
Ca5(PO4)3F + 5H2SO4 → 5CaSO4 + 3H3PO4 + HF
The formed phosphoric acid has very low concentration and purity. Consequently, it is filtered in order to remove any suspended gypsum particles. The concentration of this acid is increased by evaporation from 26% P2O5 to 52% P2O5.
The concentrated acid is further purified using settling in order to precipitate any residual suspended solids and metal phosphates, then the purified concentrated acid is stored for use in triple super phosphate plant.
During reaction, fluoride is released during acidulation as hydrogen fluoride but reacts readily with the silica exists in the raw material forming fluorosalicic acid ( H2Sif6).
In addition, gypsum is also formed as by-product during this reaction which is separated from the formed acid by filtration.
| |
| | | | Admin
Admin
عدد المساهمات : 3762
تاريخ التسجيل : 15/09/2009
العمر : 56
الموقع : مصر
| | موضوع: اولا/ مصادر وتوزيع المياه داخل خطوط الانتاج الأحد أغسطس 14, 2011 3:20 am | |
|
3. Water Supply:
Ismailia canal is the main source of water used in the company for several industrial purposes (process, cooling, equipment washing, scrubbing, water regeneration, floor washing, etc).
3.1 Description of current water usage and distribution:
The company consumes around 22,848 m3/d of water which is distributed as shown in table (1) which illustrated the total water consumption for each production plant.
Table (1): Overall water consumption & distribution
Production plant Average flow m3/hr Average flow m3/d
Sulfuric Acid Plant (units 5, 6 &7) 610 14,640
Single Super Phosphate Plant 201 4824
Phosphoric Acid Plant 70 1680
Triple Super Phosphate plant 35 840
Granulated Single Super Phosphate Plant 20 480
Granulated NPK plant 16 384
Total 952 22,848
The detailed water distribution on the different production units is shown below.
3.1.1. Water consumption in Sulfuric acid plant:
The sulfuric acid plant consists of units 5, 6 and 7 where water is consumed in several purposes mainly cooling, floor washing and processing, the total water consumption reaches 14,640 m3/d for a total production rate of 775,500 tons/yr, this amount of water consumption is distributed as shown in the following table (2).
Table (2) Water consumption & distribution in sulfuric acid plant
Operation *Units 5 & 6 Unit 7
Average flow m3/hr Average flow m3/d Average flow m3/hr Average flow m3/d
Cooling tower 180 4320 365 8760
BFW 10 240 10 240
Product water 7 168 8 192
Water treatment regeneration 7 168 8 192
Drain& floor wash 6 144 9 216
Sub-total 210 5040 400 9600
Grand-total 610 m3/hr equivalent to 14,640 m3/d
*Currently, units 5&6 for sulfuric acid production are not operating which may be resumed within 2-4 months.
3.1.2 Water Consumption in SSP Plant:
For a production rate of 1,155,000 tons/yr of SSP plant, the total water consumption is 4824 m3/day.
Table (3) shows the water consumption and distribution on different activities in SSP plant.
Table (3) Water consumption & distribution in SSP plant
Operation *SSP lines 1,2,3 SSP line 4 Mills
Average flow m3/hr Average flow m3/d Average flow m3/hr Average
flow m3/d PM30 PM20
Average flow m3/hr Average flow m3/d Average flow m3/hr Average
flow m3/d
Gas Scrubber 40 960 36 864 - - - -
Dilution unit 7 168 10 240 - - - -
Cooling tower
( future) 30 720 60 1440 - - - -
Sub-total 77 1848 106 2544 10 240 8 192
Grand-total 201 m3/hr equivalent to 4824 m3/d
*Currently, lines 1,2 and 3 for super phosphate production are not operating which may be resumed within 2-4 months.
3-1-3- Water Consumption in Phosphoric Acid Plant:
For a production rate of 136,620 tons/yr of phosphoric acid, the total water consumption is 1680 m3/d for different purposes (production, cooling and water treatment regeneration).
The distribution of water consumption in this plant is shown in table (4).
Table (4) Water consumption& distribution in Phosphoric Acid Plant
Operation Average flow m3/hr Average flow m3/day
Process water 66 1584
Water treatment regeneration 4 96
Total 70 1680
3-1-4- Water Consumption in TSP plant (SIAP plant):
The TSP plant production rate is about 204,600 tons/yr which consumes 840 m3/d in different purposes such as gas scrubbing, and cooling.
The following table (5) shows the water distribution in the TSP plant.
Table (5) Water consumption& distribution in the TSP plant
Operation Average flow m3/hr Average flow m3/day
Gas Scrubber 30 720
Cooling water 5 120
Total 35 840
3-1-5 Water Consumption in Granulated Single Super Phosphate (GSSP)
For a production rate of 528,000 tons/yr in the Granulated Single Super Phosphate plant, the total water consumption is 480m3/day.
Table (6) illustrates the water consumption and distribution on different activities in the granulated single super phosphate plant.
Table (6) Water consumption& distribution in the GSSP plant
Operation Average flow m3/hr Average flow m3/day
Gas Scrubber 10 240
Water for granulation 10 240
Total 20 480
3-1-6 Water Consumption in Granulated NPK plant:
For a production rate of 231.000 tons/yr in the granulated NPK plant, the total water consumption is 384 m3/ day.
Table (7) illustrates the water consumption and distribution on different activities in the granulated NPK plant.
Table (7) Water consumption& distribution in GNPK plant
Operation Average flow m3/hr Average flow m3/day
Gas Scrubber 10 240
Water for granulation 6 144
Total 16 384
| |
| | | | Admin
Admin
عدد المساهمات : 3762
تاريخ التسجيل : 15/09/2009
العمر : 56
الموقع : مصر
| | موضوع: مناطق تجميع وتكوين مياه الصرف الصناعى الأحد أغسطس 14, 2011 3:27 am | |
| Industrial Sewerage network and points of discharge:
The industrial effluent streams are segregated in an internal sewerage network independently from that of the domestic sewage network.
The industrial effluent network (as drawn by the company) is shown on the plant layout in figure (8).
From the figure it is shown that:
1- The solid line indicates the discharging line from both cooling towers of the sulfuric acid plant unit 5, 6 and 7 and filter backwash from the three water treatment stations serving sulfuric acid plant.
These effluents are discharged directly to Ismailia canal.
2- The dotted line indicates the discharging line from:
- Gas scrubbers of the SSP plant from lines 1,2 , 3 and 4 .
- Gas scrubbers effluent of phosphoric acid plant and TSP plant .
- Effluent from sulfuric acid plant unit 5,6 and 7.
These effluents are discharged to the on-site settling ponds.
The company discharges their industrial effluents into two receiving bodies:
1- The Ismailia Canal.
2- The Settling Ponds existing inside the company.
The company discharges some of its effluents to Ismailia Canal which are:
1- Wastewater effluent from the two cooling towers bleeding existing in sulfuric acid plant that one of them serves units 5&6 with a bleeding 90 m3/hr while the other tower serves unit 7 with a bleeding about 160 m3/hr.
2- Wastewater effluent from the Backwash of the three water stations serving sulfuric acid plant with a total flow 100 m3/hr.
The combined wastewater stream from the above units with a total flow 350 m3/hr known as the End of Pipe and discharged currently outside the company to Ismailia Canal when it fulfills the allowable law limits while this effluent is sent to the settling ponds if doesn't comply the levels of law limits.
Nowadays, the company starts in operating the new project (recirculation project) to re-use the end-of-pipe again as process water instead of discharging to Ismailia Canal.
Other effluents are discharged to the Settling Ponds existing in the company. These effluents are:
1- Effluents from gas scrubbers in SSP plant, 40 m3/hr generated from lines 1, 2 &3 and 36 m3/hr is generated from line4.
2- Effluents from gas scrubbing system in both phosphoric acid plant and TSP plant which have a flow about 10 & 30 m3/hr respectively.
3- Effluents from sulfuric acid plant (unit 5,6 &7):
- 17 m3/hr results from drain, floor washing and water regeneration from units 5&6.
- 13 m3/hr results from drain, floor washing and water regeneration from unit 7.
- 54 m3/hr results from R.O system of unit 7.
4- Part of the end-of-pipe stream is discharged using by-pass line to settling pond when some units are not operated. This amount is estimated to be nearly 50m3/hr.
Figure (8): Sewerage Network
5. Effluent characterization:
There are several industrial wastewater streams in AZFC Company.
These industrial wastewater streams are discharged to two receiving bodies :
Ismailia Canal and settling bonds existing in the company.
- Sources of industrial wastewater effluents:
5.1-Sulfuric acid plant:
• Discharged wastewater stream from the two cooling towers bleeding. One of them serves units 5 and 6 with bleeding reaches 90 m3/hr while the other one serves unit 7 and has a bleeding reaches 160 m3/hr.
• Discharged wastewater stream from the backwash of the three water stations existing in sulfuric acid plant. Total flow of discharged backwash water is 100 m3/hr.
The above streams with a total flow of 350 m3/hr will be treated and recycled in the near future instead of discharging to Ismilia Canal.
• 17 m3/hr results from drain, floor washing and water regenerated from units 5&6.
• 13 m3/hr results from drain, floor washing and water regenerated from unit 7.
• 54 m3/hr results from R.O system from unit 7.
These effluents with a total flow of 84 m3/hr are discharged to the settling ponds.
The following table (8) summarizes effluents generated from sulfuric acid plant.
Table (8) Effluents from Sulfuric acid plant
Effluent Flow rate (m3/hr)
Cooling tower bleeding for units (5&6) 90
Cooling tower bleeding for unit 7 160
Backwash of the three water stations of sulfuric acid plant 100
• drain, floor washing and water regenerated from units 5&6. 17
• drain, floor washing and water regenerated from unit 7 13
• Effluent of RO unit 54
5.2. SSP Plant:
Effluent streams are generated from the different activities in the SSP plant as follows:
a- Wastewater stream from lines 1, 2&3 with a flow of about 40 m3/hr.
b- Wastewater stream from line 4 with a flow of about 36 m3/hr.
c- Wastewater stream from cooling tower bleeding with a flow of about 30 m3/hr.
The following table summarizes these effluent streams:
Table (9) Effluents from SSP Plant
Effluent Flow rate (m3/hr)
Effluent from lines 1,2 &3 40
Effluent from line 4 36
Cooling Tower Bleeding 30
5.3 GSSP Plant:
Although GSSP plant is designed to have zero effluent discharge, it actually has one source of wastewater effluent generated from gas scrubber which is used to recover carried over fine granules.
This only source of wastewater effluent has approximate flow of about 10 m3/hr, the following table(10) shows effluent from GSSP plant
Table (10) Effluent from GSSP plant
Effluent Flow rate (m3/hr)
GSSP gas scrubber 10
5.4. Phosphoric Acid Plant
PAP plant consists of one production line where wastewater effluents are generated from two sources:
• Wastewater stream from scrubbers associated to the acidulation reaction and to the acid concentration (HF and H2SiF6), this effluent stream reaches about 10 m3/hr.
• Wastewater stream from water treatment regeneration with a flow rate of 4 m3/hr. The following table (11) summarizes waste effluents streams
Table (11) Effluents from Phosphoric Acid Plant
Effluent Flow rate (m3/hr)
Effluent from Scrubbers 10
Effluent from water treatment regeneration 4
5.5. TSP plant:
TSP plant has one main effluent stream generated from gas scrubbers which are used to recover the carried over fines and to catch the fluoride vapors from the reactor as fluorosilicic acid with a total flow of about 30m3/hr.
The following table (12) shows effluent from TSP plant
Table (12) Effluent from TSP plant
Effluent Flow rate (m3/hr)
TSP gas scrubber 10
5.6. GNPK plant:
Although GNPK plant is designed to have zero effluent discharge, it actually has one source of wastewater effluent generated from gas scrubber which is used to recover carried over fine granules.
This only source of wastewater effluent has approximate flow of about 10 m3/hr, the following table (13) shows effluent from GNPK plant
Table (13) Effluent from GNPK plant
Effluent Flow rate (m3/hr)
GNPK gas scrubber 10
| |
| | | | Admin
Admin
عدد المساهمات : 3762
تاريخ التسجيل : 15/09/2009
العمر : 56
الموقع : مصر
| | موضوع: تقييم جودة ونوعية مياه الصرف الناتجة من خطوط الانتاج المختلفة الأحد أغسطس 14, 2011 3:32 am | |
| 7. Evaluation of Waste Effluents Quality:
A scheme of sampling and analysis was applied in this study to evaluate the different effluent streams generated from each production unit, water stations and end of pipe. Figure (9) indicates the sampling points.
Analysis of the samples was conducted in both the internal Lab of the company and an approved external Lab (The National Research Center).
At the time of the study some production units were not operating and under upgrading. For this reason previous analysis conducted by the company lab when these units operated is used in the data analysis. The following table (14) indicates the sampling scheme.
Two wastewater samples were collected and analyzed partly by outside laboratory (National Research Council) for BOD & COD analysis while other parameters for the same samples are measured in the company laboratory( TSS,TDS,pH,PO4-3,FREE cl2, CL-)
The two samples collected are:
1- End –of-pipe effluent (cooling towers bleeding of unit 7+ backwash water) of sulfuric acid plant (unit 5 & 6 were out of operation).
2- Effluent from single super phosphate line 4 which was operating (line 1, 2 & 3 were out of operation)
Figure (9) Sampling Points
Table (14): The Sampling Scheme
Sample location Laboratory Type of sample Date
Sulfuric acid plant unit 5,6 Internal Lab Previous analysis (Grap) 25/11/2010,27/11/2010
Sulfuric acid plant unit 7 Internal Lab Previous analysis (Grap) 5/2/2011, 12/2/2011, 5/3/2011
Single super phosphate plant line (3) Internal Lab Previous analysis 5/2/2011, 12/2/2011, 5/3/2011
Backwash of the three water treatment units Internal Lab Previous analysis 5/2/2011, 12/2/2011, 5/3/2011
End of pipe stream to Ismailia Canal The National Research Center + Company laboratory Two New Samples 27/3/2011
Line (4) of SSP The National Research Center + Company laboratory Two New Samples 27/3/2011
7.1 Evaluation of End-of-pipe effluent
Units 5 & 6 H2SO4 Plant
Previous analysis conducted on in the company laboratory waste effluents from unit 5 & 6 are used to characterize this effluent, average values of samples analyzed on 25/ 11/ 2010 & 27/ 11/ 2010 are calculated as shown in table (15)
Table (15) analysis results bleeding of cooling tower I
Serving units 5 & 6 H2SO4 Plant
(Flow 90 m3/ hr)
Parameter
(mg/ l) 25/ 11/ 2010 27/ 11/ 2010 Average
pH 8.9 6.9 6.9 - 8.9
Chloride 41.78 42.46 42.12
PO4-3 0.67 2.14 1.405
TDS 37.7 30 33.8
TSS 22.5 51 36.7
Free Cl2 0.01 0.01 0.01
The results show slightly increased levels pH, PO4-3 and TSS that exceeds the allowable law limits (PO4-3 1 ppm & TSS 30 ppm) for discharging to Ismailia Canal.
Unit 7, H2SO4 Plant:
The effluent generated from unit 7 is a mixture of the cooling tower bleeding and RO wastewater (flow 160 m3/ hr)
The chemical analysis averaged over 3 days in February 2011 is shown in table (16):
Table (16): Analysis results of waste effluent from unit 7, H2SO4 plant
(Flow 160 m3/ day)
Parameter
(mg/ l) 5/ 2/ 2011 12/ 2/ 2011 5/ 3/ 2011 Average
pH 8.53 8.57 8.73 8.53 - 8.73
Chloride 47.18 40.44 38.41 42
Free Cl2 Nil Nil Nil Nil
PO4-3 5 1.61 0.67 2.43
TDS 369 372 321 354
TSS 60 11 6 25.7
The results show an increase of PO4-3 levels which exceed the law limits (1 mg/ l)
Backwash of the three water treatment units:
The effluent was also analyzed over three days by the company laboratory on dates: 5/ 2/ 2011, 12/ 2/ 2011 & 5/ 3/ 2011 and the results are shown in table (17).
Table (17) Backwash from the three water station existing in
Sulfuric acid plant
(Flow100 m3/ hr)
Parameter
(mg/ l) 5/ 2/ 2011 12/ 2/ 2011 5/ 3/ 2011 Average
pH 7.51 7.9 7.8 7.51 – 7.9
Chloride 29.65 28.3 28.3 29
PO4-3 0.3 0.0 0.22 0.2
TDS 239 230 235 235
TSS 413 301 410 375
The result show an appreciable increase in the TSS levels far exceeding the law limits (30 mg/ l).
A recent sample of end-of-pipe effluent was analyzed and compared with the calculated levels of the same mixture based on average previous analysis.
Water balance is used to estimate the levels of contaminants of the mixture based on the individual effluent analysis as shown in table (18) and compared to the most recent analysis conducted during the study.
Table (18) Characterization of EOP Mixture
Parameter
(mg/ l) Previous Analysis (average value) Recent measured parameters Law limits 48/ 82
Unit 5/ 6 (a) Unit 7 (b) Backwash (c) Calculated values for mixture
Flow m3/ hr 90 160 100 350 350 -
pH 6.9-8.9 8.5-8.7 7.5-7.9 6.9-8.9 8.07 6-9
Cl' 42.12 42 29 38.4 - -
Free Cl2 0.01 0.01 0.02 0.013 0.01 1
PO4-3 1.405 2.43 0.2 1.5 0.54 1
TDS 33.8 354 235 238 304 800
TSS 36.7 25.7 375 128 356 30
BOD - - - - 18 20
COD - - - - 35 30
The values shown in table (17) indicate that PO4-3 and TSS could exceed the law limits for discharging to Fresh Water Canals (law 48/ 82).
However, the rest of parameters lies in the range of law limits. The new treatment project for recycling the EOP mixture will adjust the pH and decrease the levels of PO4-3 & TSS by settling.
| |
| | | | Admin
Admin
عدد المساهمات : 3762
تاريخ التسجيل : 15/09/2009
العمر : 56
الموقع : مصر
| | موضوع: التصميم المناسب لمعالجة الصرف الصناعى الناتج من خطوط الانتاج الأحد أغسطس 14, 2011 3:36 am | |
| 8- The Company New Project:
Currently, the company is implementing a new project in order to treat and recycle effluents from the sulfuric acid plant with total flow of (350 m3/hr) these effluents are:
-Effluent from cooling tower bleeding of unit 5,6 of Sulfuric acid plant (90 m3/d).
-Effluent from cooling tower bleeding of unit 7 of Sulfuric acid plant (160 m3/d).
-Back wash of the three water stations (100 m3/hr).
These effluents will be chemically treated then reused instead of being discharged to Ismailia Canal.
9- Findings:
• The total waste effluent flow reaches 619 m3/hr (14856 m3/d).
• About 350 m3/hr waste effluent with low levels of contaminants are discharged to Ismailia Canal.
• The new recycling project for treating this effluent for pH adjustment and settling of suspended solids seems to be adequate to achieve the proper quality for recycling also for the effluent to reach compliance with the law for discharging to Ismailia Canal.
• Effluents discharged to settling ponds ( 269m3/hr) have low pH values ( extremely acidic),high T.S.S., PO4-3,T.D.S.,BOD & COD and do not comply with law 48/82 for discharging to underground water as the existing settling ponds are not lined.
10- Recommendations:
• Study the possibility of discharging waste effluents to Abu zaabal public sewer or railway sewerage lines after treatment for compliance.
• Segregation of cooling tower bleeding effluent has SSP plants with total flow of 45 m3/hr and discharge without treatment either to settling ponds or to the closest public sewer network.
• Chemical treatment of the rest effluents (224 m3/hr) (currently discharged to ponds) for pH adjustment and PO4-3 precipitation then discharge to the closest possible public sewer or to the settling ponds after mixing with the untreated cooling tower bleeding water before discharge.
• Modifying the parameters measured on routine basis in the company laboratory to be suitable for determination of pollution parameters in the company wastewater effluent these are:
- pH
- TSS
- TDS
- BOD
- COD
- O & G
- PO4-3
- Fluoride F -
• Providing the company laboratory with the necessary equipment and standard methods to conduct the above mentioned analysis
• Follow a self monitoring program for wastewater effluents to measure the main pollution parameters in an authorized laboratory (until completing the company lab) and check compliance with regulations.
| |
| | | | Admin
Admin
عدد المساهمات : 3762
تاريخ التسجيل : 15/09/2009
العمر : 56
الموقع : مصر
| | موضوع: مصادر تكوين الصرف الصناعى الملوث الخميس أغسطس 18, 2011 4:01 pm | |
| Service Units and Related Pollution Sources
Medium and large size plants will have some/all of the following service and auxiliary units. These units can be pollution sources and therefore should be inspected and monitored. Fig (16) shows the various units with their corresponding raw materials and potential pollution sources.
Boilers
Boilers are used to produce steam for:
heat supply to the processes, reaction (steam reforming) and CO shift converter (in ammonia production and other processes utilizing steam).
electric power generation.
Conventional steam-producing thermal power plants generate electricity through a series of energy conversion stages.
Fuel is burned in boilers to convert water to high-pressure steam, which is then used to drive the turbine to generate electricity.
The gaseous emissions generated by boilers are typical of those from combustion processes.
The exhaust gases from burning fuel oil (Mazot) or diesel oil (solar) contain primarily particulates (including heavy metals if they are present in significant concentrations in the fuel), sulfur and nitrogen oxides (SOx and NOx) and volatile organic compounds (VOCs).
The concentration of these pollutants in the exhaust gases is a function of firing configuration (nozzle design, chimney height), operating practices and fuel composition.
Gas-fired boilers generally produce negligible quantities of particulates and pollutants.
Wastewater is generated as blowdown purged from boilers to keep the concentration of dissolved salts at a level that prevents salt precipitation and consequently scale formation.
The blowdown will be high in TDS.
In the case of power plants, water is used for cooling the turbines and is also generated as steam condensate.
The amount of wastewater generated depends on whether cooling is performed in open or closed cycle and on the recycling of steam condensate. Contamination may arise from lubricating and fuel oil.
Water Treatment Units
There are different types of water used in industry. Depending on the application and the water source, different treatment processes are applied.
Water Softening for medium hardness water
Calcium and magnesium ions are removed from hard water by cation exchange for sodium ions.
When the exchange resin has removed the ions to the limits of its capacity, it is regenerated to the sodium form with a salt solution (sodium chloride) in the pH range of 6-8.
This is performed by taking the softener out of service, backwashing with the salt solution, rinsing to eliminate excess salt, then returning it to service. The treated water has a hardness level of less than 1 ppm expressed as calcium carbonate.
Water softening for very high bicarbonate hardness
Water from wells and canals is pre-treated before softening. Water is treated first by the lime process, then by cation exchange.
The lime process reduces dissolved solids by precipitating calcium carbonate and magnesium hydroxide from the water.
It can reduce calcium hardness to 35 ppm if proper opportunity is given for precipitation.
A coagulant such as aluminum sulfate (alum) or ferric sulfate is added to aid magnesium hydroxide precipitation.
Calcium hypochlorite is added in some cases. Currently the use of organic poly-electrolytes is replacing many of the traditional inorganic coagulant aid.
Sludge precipitates and is discharged to disposal sites whereas the overflowing water is fed to a sand filer followed by an activated carbon filter that removes any substances causing odor and taste.
A micro filter can then be used to remove remaining traces. A successful method to accelerate precipitation is contacting previously precipitated sludge with the raw water and chemicals.
The sludge particles act as seeds for further precipitation. The result is a more rapid and more complete reaction with larger and more easily settled particles.
Water Demineralization
Water demineralization units are indispensable units in industrial plants.
These units provide the relevant water, after removing the soluble salts, for pressure boilers and dematerialized necessary for process (as process water for nitric acid, sulphuric acid .. etc).
The removal of salts in the raw water is carried out by special resins through ion exchange.
The raw water is pumped to cation, anion (and mixed bed) exchangers.
The resins when exhausted (saturated with salts) are regenerated using various chemicals such as sodium chloride, hydrochloric acid or sulphuric acids and sodium hydroxide.
The effluents during these regeneration processes (twice a day) represent a considerable source of pollution.
Cooling Towers
Cooling water is used extensively in industry. During the cooling process, water heats up and can only be reused if cooled.
Cooling towers provide the means for recycling water and thus minimizing its consumption.
The cooling effect is performed through partial evaporation. This causes an increase in the concentration of dissolved salts which is controlled by purifying some water (blowdown).
The blowdown will be high in TDS.
Compressors
Several types of compressors are needed in the fertilizers plants, including the ammonia, steam, gas and air compressors.
Compressors consume a considerable quantities of lube oils for lubrication and cooling purposes, in addition to electricity.
The major resulting pollutants are noise affecting workers and the spent oils.
Lube oils are essential for several parts of the compressors. It utilizes as a pillow which facilitate the revolving motion, in addition to the absorption of resulted heat due to friction.
When the compressor is started-up a pump drafts the oil from its storage tank, to a filter and an oil cooler.
The lube oil, after passes through different parts of the compressor, is collected back in the oil tank.
Ammonia compressing is composed of two stages, the first includes two cylinders and the second four.
No greasing is applied inside the cylinders, but only the other parts are being greased in order to lower the friction.
The temperature of a gas arises by compression, hence it needs to be cooled before any further compression.
Compressing is done by the piston inside the cylinder, in which the gases in front of the piston are being pressed until their pressure equalize the repelling pipe pressure.
This opens the discharging valve and compressed gases exit into their path. The suction valve is consequently opened and gases introduce the cylinder behind the piston.
These types are named the frequency compressors. Gaseous leaks may result from the compressors, which generate a pollution problem in the work place of the unit.
A good check should be implemented for the equipment in order to avoid operating problems, such as clogging in the filter of oil suction pump, leaks from the non-return valve, broken pipelines of any other parts, temperature increasing than usual, decreasing in cooling efficiency …etc. The compressor’ motor is cooled by cold air.
Laboratories
There are several laboratories in the fertilizers plants which are responsible for different activities, as follows:
Research laboratory, responsible for developing, through research and analysis, new types of fertilizers as well as studying the different effects on soil and plant.
Quality control laboratory, responsible for the analysis of the different products and comparing the findings with the standard specifications. It also analyze the raw materials inputs to the different units of the plant.
Environmental laboratory, responsible for the collection of periodical routine and sudden random samples to control air and water pollution. It is also responsible for the performance of water and wastewater treatment units, through periodic analysis for the inlet and outlet streams.
Different types and quantities of hazardous chemicals are used for different testing and analysis. Proper handling and storage are required for compliance with environmental law.
Workshops and Garage
Large facilities have electrical and mechanical workshops for maintenance and repair purposes. Environmental violations could be due to:
• Noise
• Rinse water contaminated with lube oil
Pollution in the garage area will depend upon the services offered. The presence of a gasoline or diesel station implies fuel storage in underground or over the ground tanks that require leak and spill control plans.
Replacing lube oil implies discharge of spent oil to the sewer lines or selling it to recycling stations. Washing agents and solvents may be used.
Wastewater Treatment Plants
Although a WWTP is a pollution abatement measure, it has to be inspected and monitored for potential pollution.
Pollution may be due to malfunctioning or improper management.
Disregarding treatment of boilers and cooling towers blowdown, which is by far the largest wastewater problem in the industry, several treatment schemes have been used.
Most approaches have been based on the origin of the product, that is phosphate or nitrogenous fertilizer.
The effluent streams can be characterized as either a phosphoric acid effluent or an ammonia effluent.
The phosphoric acid effluent is high in fluoride concentration, low in pH, high in phosphate and in suspended solids.
Standard practice has been to contain the water for reuse, allowing enough time for solids sedimentation.
The problem is that fresh water addition may result in overflow of the retained water.
The retention ponds should be carefully designed. If overflow is evident, it must be treated with lime and clarified.
A slightly more sophisticated method for discharging overflow water is with a two-stage liming process.
The first lime treatment brings the pH up to 3 or 4 and reduces the fluoride concentration to 20- 25 mg/ l and the P concentration to 50- 60 mg/ l.
The CaF2 precipitate is settled out and the effluent is treated again with lime to raise the pH to 6 or 7.
The F and P concentrations are reduced to about 10 mg/ l. the water is clarified and released to a receiving stream.
The two-stage fluoride removal process of lime precipitation followed by alum-polyelectrolytes flocculation and sedimentation was found to be workable.
Maximum precipitation of fluoride with lime occurs at a pH greater than or equal to 12 and optimum coagulation with the alum-polyelectrolyte occurred at a pH of about 6 to 7.
The other effluent type is characteristic of ammonia production and ammonia containing products.
Most of the contamination comes from the production of the ammonia itself. It is characteristically high in ammonia from effluent gas scrubbing operation and high in ammonia, total suspended solids and carbamate.
These effluents require a pH adjustment and settling.
The treated effluent is discharged to the receiving media and a final sludge is remained. Safe sludge disposal should be implemented, due its high content of hazardous constituents such as heavy metals, phosphorous, ammonia and silicates.
| |
| | | | Admin
Admin
عدد المساهمات : 3762
تاريخ التسجيل : 15/09/2009
العمر : 56
الموقع : مصر
| | موضوع: الملوثات الخميس أغسطس 18, 2011 4:03 pm | |
| Wastewater from the fertilizer industry can be classified into four groups:
Process effluents resulting from contact with gas, liquids, or solids
Dedicated effluents which may be separated for use in one process or for recycling at a controlled rate
Effluents from general services such as cleaning or pretreatment
Occasional effluents such as leaks or spills
Wastewater is generated in any fertilizer production facility by leaks, spills, cleaning, maintenance, and laboratory tests.
Cooling water may contain ammonia, sulfate, chloride, phosphate, chromate, and dissolved solids which become concentrated through evaporation.
Phosphate Fertilizers
Effluents include wastewater from water treatment unit, cooling towers and boilers blowdown, spills and leaks, surface run-off. Cooling water is not significantly contaminated in most cases.
Another contaminated stream may result from condensers, heat exchangers and gas scrubbers.
It was found that the main sources of pollution are attributed to the washing water of the scrubbing towers.
Primary parameters for wastewater are phosphorous, fluorides, silicate, suspended solids and pH.
Phosphoric acid production creates large quantities of pond water for cooling of the process, concentration of the product and for processing and storage of the gypsum byproduct.
Gypsum slurry water is decanted from the top of the gypsum stacks and sent to the cooling pond through collection ditches
Through evaporation and recycling, contaminant concentrations in pond water can reach several grams per liter of phosphates and fluoride.
Additional elemental contaminants in pond water which originate in phosphate rock are arsenic, cadmium, uranium, vanadium, and radium.
typical characterization of wastewater from superphosphate fertilizer and phosphoric acid production units:-
Source (1): washing water of scrubbing towers in the single superphosphate unit.
Source (2): Washing water from scrubbing tower in the triple superphosphate unit.
Source (3): cooling water from the dilution of sulphuric acid unit.
Source (4): final effluent.
Characterization of wastewater From Phosphoric Acid Production Unit
Source (1): cooling water.
Source (2): process water (washing water).
Solid Wastes
For all fertilizers plants, solid materials may be found in storage piles, settled dust and other similar forms. The following are the major solid wastes in different production lines of fertilizers.
Phosphate Fertilizers
Single Superphosphate Production
Off-specification product, products spills, and dusts collected in emission control systems are potential sources of residual wastes. Products are occasionally suspended or canceled, leaving stockpiles of residual product.
Triple Superphosphate Production
Sources of solid wastes in this production line are spent containers, wastewater treatment sludges, and spent filters.
Many of these wastes are transported offsite for disposal. However, with good housekeeping techniques and dedicated systems, some of these wastes may be recycled back into the process instead of being wasted.
Phosphoric Acid Production
One of the largest solid wastes in this production unit is phosphogypsum.
Approximately 1.5 tons of phosphogypsum is produced per ton of phosphate rock fed, or 5 tons per ton of phosphoric acid produced (expressed as P2O5). Gypsum (calcium sulphate dihydrate) is a mineral which also occurs in nature.
Phosphogypsum is produced by the reaction of phosphate rock with sulphuric acid during the process of producing phosphoric acid.
The use of waste phosphogypsum for other purposes has been widely encouraged, but economic and/or quality problems and/or the demand for the resulting products frequently inhibit or prevent this.
These problems relate not only to the impurities in the gypsum, but also to its relatively high moisture content. Plasterboard, plaster, and cement are the main possibilities.
It is also possible to recycle phosphogypsum in sulphuric acid production.
Dumping gypsum on land is not possible everywhere because the material settles and dries slowly and requires an adequate land area and certain climatic and soil conditions where the stack is situated.
Gypsum stacks are being increasingly regulated in terms of lining and cap systems to prevent contaminated leaching or runoff .
Cadmium is a heavy metal which accumulates in living systems and can become toxic above certain limits.
The quantity of cadmium contained in a phosphatic fertilizer depends on the source of the rock or waste material from which it was made.
The cadmium content of phosphate rocks varies from almost zero to over 300 mg/kg P2O5. The acidulation of phosphate rock partitions the cadmium between the fertilizer product and the by-products, mainly the phosphogypsum arising from phosphoric acid production.
Sulphuric Acid Production
Spent catalyst is generated from this production line and usually returned to the licensor.
The vanadium content of the V2O2 catalysts can be reclaimed for further use. This service is usually provided by the catalyst manufacturer.
The metal can be recycled as vanadium salts or ferrovanadium for steel production.
Ammonium Sulphate Production
Ammonium sulphate crystals during conveying and bagging are collected and recycled.
Ammonium Phosphate Production
Spills of the fertilizers in the bagging section are collected and recycled.
Inputs and Pollution Sources and Types in the Fertilizers Industry
Liquid Wastes
Single Super Phosphate
Wastewater containing H2SiF6 and S.S
Triple Superphosphate
Wastewater containing H2SiF6 and S.S
Phosphoric Acid Production
Wastewater recycled to the reactor (rich in H3PO4)
Waste water containing fluoride phosphate and sulphate
Wash wastewater recycled to the reactor
Separated water recycled to the reactor (rich in fluorides and trace metals)
Condensate
Sulphuric Acid Production
H2SO4 spills
Steam condensate
Leaks and spills of H2¬ SO4
Synthetic Ammonia Production
Acidic steam condensate
Condensate to steam traps
Solvent recycled after regeneration
Wastewater (ammonia and methanol)
Waste cooling water to cooling tower
Ammonium Nitrate Production
Wastewater (NH3 and ammonium nitrate)
Condensate (NH3 and ammonium nitrate)
Ammonium Sulphate Production
Wastewater (ammonium sulphate)
Wastewater (ammonium sulphate)
Ammonium Phosphate Production
Wastewater containing ammonia and phosphoric acid
| |
| | | | Admin
Admin
عدد المساهمات : 3762
تاريخ التسجيل : 15/09/2009
العمر : 56
الموقع : مصر
| | موضوع: كيفية معالجة الملوثات لخط انتاج حمض الفوسفوريك الخميس أغسطس 18, 2011 4:05 pm | |
|
Firstly
Treatment of Phosphate Industry Wastes
INTRODUCTION
The phosphate manufacturing and phosphate fertilizer industry includes the production of elemental phosphorus, various phosphorus-derived chemicals, phosphate fertilizer chemicals, and other nonfertilizer phosphate chemicals .
Chemicals that are derived from phosphorus include phosphoric acid (dry process), phosphorus pentoxide, phosphorus pentasulfide, phosphorus trichloride, phosphorus oxychloride, sodium tripolyphosphate, and calcium phosphates .
The nonfertilizer phosphate production part of the industry includes defluorinated phosphate rock, defluorinated phosphoric acid, and sodium phosphate salts.
The phosphate fertilizer segment of the industry produces the primary phosphorus nutrient source for the agricultural industry and for other applications of chemical fertilization.
Many of these fertilizer products are toxic to aquatic life at certain levels of concentration, and many are also hazardous to human life and health when contact is made in a concentrated form.
The specific types of wastewater sources in the phosphate fertilizer industry are :-
(a) water treatment plant wastes from raw water filtration, clarification, softening and deionization, which principally consist of only the impurities removed from the raw water (such as carbonates, hydroxides, bicarbonates, and silica) plus minor quantities of treatment chemicals;
(b) closed loop cooling tower blow down , the quality of which varies with the makeup of water impurities and inhibitor chemicals used (note: the only cooling water contamination from process liquids is through mechanical leaks in heat exchanger equipment, and shows the normal range of contaminants that may be found in cooling water blow down systems .
(c) boiler blow down , which is similar to cooling tower blow down but the quality differs .
(d) contaminated water or gypsum pond water, which is the impounded and reused water that accumulates sizable concentrations of many cations and anions, but mainly fluorine and phosphorus concentrations of 8500 mg/L F and in excess of 5000 mg/L P are not unusual; concentrations of radium 226 in recycled gypsum pond water are 60–100 picocuries/L, and its acidity reaches extremely high levels (pH 1–2);
(e) wastewater from spills and leaks that, when possible, is reintroduced directly to the process or into the contaminated water system.
(f) nonpoint-source discharges that originate from the dry fertilizer dust covering the general plant area and then dissolve in rainwater and snowmelt, which become contaminated.
Range of Concentrations of Various Chemicals in Phosphate Ores
Chemical Range
Fluorine 2.8–5.6%a
Sulphur (SO3) 0.8–7.52%a
Carbon (CO2) 2.07–10.7%a
Strontium 180–1683 ppmb
Manganese 0.001–0.004%a
Barium 0.044–0.40%a
Chlorine 0.20–1.42%a
Zinc 59–765 ppmb
Nickel 7–244 ppmb
Cobalt 31–34 ppmb
Chromium 12–895 ppmb
Copper 18–46 ppmb
Vanadium 0.03–0.08%a
Cadmium 0.038–1.5 ppmb
Uranium 4–8 ppmb
P2O5 40–55%c
Silica 3–34%c
Carbon (C) 14–48%c
The federal guidelines for state and local pretreatment programs reported the raw wastewater characteristics) in mg/L concentration, and flows and quality parameters based on the production of 1 ton of the product manufactured, for each of the six subcategories of the phosphate manufacturing industry.
Raw Wastewater Characteristics of Phosphate Fertilizer Industry Retention Ponds
Quality parameter Phosphate (A)
Suspended solids (mg/L) 800–1200
pH (unit) 1–2
Ammonia (mg/L) 450–500
Sulfate (mg/L) 4000
Chloride (mg/L) 58
Total phosphate (mg/L) 3–5M
Fluoride (mg/L) 6–8.5M
Aluminum (mg/L) 110
Iron (mg/L) 85
Radium 226 (picocuries/L) 60–100
Range of Concentrations of Contaminants in Cooling Water
Cooling water contaminant Concentration (mg/L)
Chromate 0–250
Sulfate 500–3000
Chloride 35–160
Phosphate 10–50
Zinc 0–30
TDS 500–10,000
TSS 0–50
Biocides 0–100
Range of Concentrations of Contaminants in Condenser Waste from Electric Furnace Production of Phosphorous
Quality parameter Concentration or value
pH 1.5–2.0
Temperature 120–1508F
Elemental phosphorus 400–2500 Mg/L
Total suspended solids 1000–5000 Mg/L
Fluorine 500–2000 Mg/L
Silica 300–700 Mg/L
P2O5 600–900 Mg/L
Reducing substances (as I2) 40–50 Mg/L
Ionic charge of particles Predominantly positive
Effluent Limitations (mg/L) for Subpart A, Phosphate Fertilizer
Effluent characteristic Maximum for any 1 day Average of daily values
(a) BPT
Total phosphorus (as P) 105 35
Fluoride 75 25
TSS 150 50
(b) BAT
Total phosphorus (as P) 105 35
Fluoride 75 25
(c) BCT
TSS 150 50
(d) NSPS
Total phosphorus (as P) 105 35
Fluoride 75 25
TSS 150 50
(e) Contaminated nonprocess wastewater
Total phosphorus (as P) 105 35
Fluoride 75 25
The waste water treatment process
a combined biological-chemical precipitation process involving the use of the following process steps:
1. Treatment of incoming wastewater (usually primary effluent) in an aeration basin to transfer phosphorus from the incoming wastewater to the “P-stripped activated sludge microorganisms” under aerobic conditions.
2. Separation of the spent activated sludge microorganisms from the aeration basin effluent by either a conventional sedimentation clarifier (with 2 hours definition time or DT), or by a high-rate dissolved air flotation (DAF) clarifier (with 15 minutes DT)
3. Discharge of the almost P-free clarifier effluent into a receiving water, while discharge of the P-concentrated clarifier sludge (either settled sedimentation clarifier sludge, or the floated DAF clarifier sludge) to a phosphate stripper (i.e., a thickener-type holding tank with 5–15 hours DT) where the clarifier sludge is subjected to anoxic/anaerobic conditions to induce phosphorus release from the clarifier sludge into the aqueous phase .
4. Chemical precipitation of the newly released phosphate in the phosphate stripper effluent (i.e., a P-rich, low-volume sidestream containing 40–80 mg/L P;
amounting to about 10–15% of the total wastewater flow) using lime, ferric chloride, or alum, and subsequently flotation of the P-rich precipitated chemical sludge for reuse as a fertilizer using a high-rate DAF clarifier (15 min DT).
5. Collection of the phosphate-stripped activated sludge, which has extremely high phosphorus uptake capacity from the stripper.
6. Return of the phosphate-stripped activated sludge to the aeration basin for reuse in a new cycle, where the phosphate-stripped activated sludge microorganisms are again induced to take up dissolved phosphorus in excess of the amount required for growth under aerobic conditions.
The above P-removal process system reduces the volume of the wastewater to be treated(10–15% of total wastewater flow), thereby reducing the chemical dosage
required, the amount of chemical sludge produced, and associated costs.
Lime can be used to remove phosphorus from the stripper supernatant at lower pH levels (8.5–9.0) than normally required, although alum and ferric chloride are equally effective.
The process is capable of reducing the total phosphorus concentration of typical municipal wastewaters to 1 mg/L or less.
Adoption of a DAF clarifier instead of sedimentation clarifier for both secondary clarification and P-rich precipitated chemical sludge separation significantly reduces process time, and, in turn, saves overall capital and O&M costs .
THANKS FOR REGARDING
TECHNOLAB EL-BAHAA GROUP
WASTE WATER TREATMENT DEPARTMENT
COLONEL.DR
BAHAA BADR EL-DIN
CHEMICAL CONSULTANT
| |
| | | | | | دراسة جدوى وتصميم وتوريد وتركيب محطات معالجة الصرف الصناعى لخطوط الانتاج بمصنع ابوزعبل للكيماويات والاسمدة | |
|
مواضيع مماثلة | |
|
| | صلاحيات هذا المنتدى: | لاتستطيع الرد على المواضيع في هذا المنتدى
| |
| |
| |
|